Note
Go to the end to download the full example code. or to run this example in your browser via Binder
Expand segmentation labels without overlap#
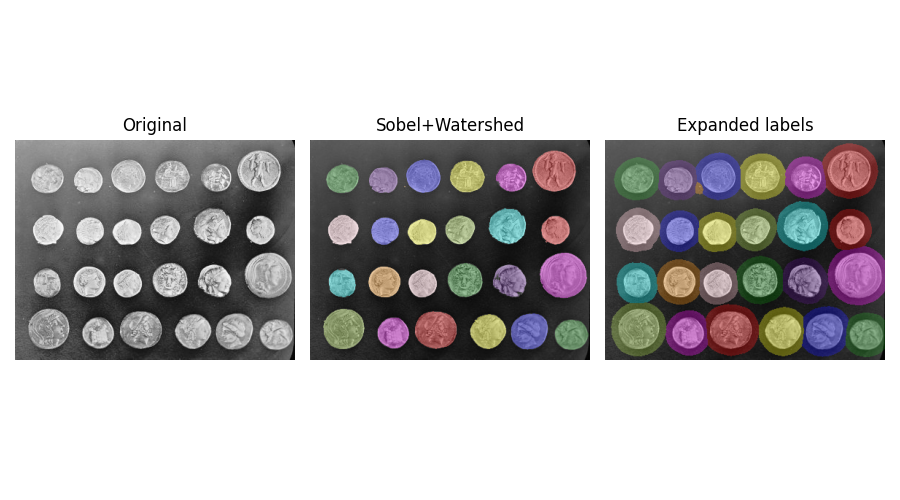
Given several connected components represented by a label image, these
connected components can be expanded into background regions using
skimage.segmentation.expand_labels().
In contrast to skimage.morphology.dilation() this method will
not let connected components expand into neighboring connected components
with lower label number.

import matplotlib.pyplot as plt
import numpy as np
from skimage import data
from skimage.color import label2rgb
from skimage.filters import sobel
from skimage.measure import label
from skimage.segmentation import expand_labels, watershed

coins = data.coins()

# Make segmentation using edge-detection and watershed.
edges = sobel(coins)

# Identify some background and foreground pixels from the intensity values.
# These pixels are used as seeds for watershed.
markers = np.zeros_like(coins)
foreground, background = 1, 2
markers[coins < 30.0] = background
markers[coins > 150.0] = foreground

ws = watershed(edges, markers)
seg1 = label(ws == foreground)

expanded = expand_labels(seg1, distance=10)

# Show the segmentations.
fig, axes = plt.subplots(
    nrows=1,
    ncols=3,
    figsize=(9, 5),
    sharex=True,
    sharey=True,
)

axes[0].imshow(coins, cmap="Greys_r")
axes[0].set_title("Original")

color1 = label2rgb(seg1, image=coins, bg_label=0)
axes[1].imshow(color1)
axes[1].set_title("Sobel+Watershed")

color2 = label2rgb(expanded, image=coins, bg_label=0)
axes[2].imshow(color2)
axes[2].set_title("Expanded labels")

for a in axes:
    a.axis("off")
fig.tight_layout()
plt.show()
Total running time of the script: (0 minutes 0.575 seconds)
